Symptoms
When the battery pack loses capacity, bars begin to disappear from the “capacity gauge” (thin 12-segment gauge to the immediate right of the 12-segment state of charge gauge). The first known Nissan LEAF to have its battery pack replaced was reported in November, 2011 when an owner in the Phoenix area reported a missing battery capacity bar on the dash instrument and reduced range. In April 2012 another Phoenix area LEAF driver reported the same issue. All LEAFs reported to have battery capacity loss have been in hotter climates (mainly Arizona, Texas and California). Note that per the Nissan Leaf Service Manual, the first capacity bar loss represents a 15% loss, while each subsequent bar represents only a 6.25% loss.
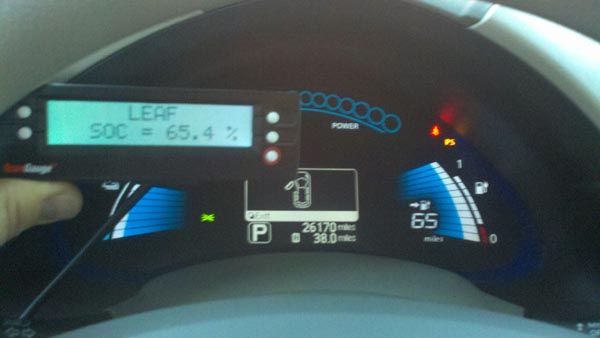
LEAF showing 3 bars of battery capacity loss, with GID meter reading:
Factors Affecting Battery Capacity Loss
Each Lithium ion battery chemistry has unique properties that affect the rate of capacity loss. According to Charles Whalen:
“You’re correct that the Volt’s and Leaf’s respective battery packs have nearly identical chemistry, both using a lithium-manganese cathode. They both have the same sensitivity to high temps. Out of all the various lithium cathodic chemistries, lithium-manganese is the most heat sensitive and has the highest and fastest rate of capacity decay and degradation at higher temperatures.”
- The Leaf’s battery cell is manufactured by NEC, is a pouch type cell with stacked elements, a LiMn2O4 cathode from Nippon Denko, a graphite anode from Hitachi Chemicals, a Celgard PP dry separator, and an EC type LiPF6 electrolyte from Tomiyama.
- The Volt’s battery cell is manufactured by LG Chem, is a pouch type cell with stacked elements, a LiMn2O4 cathode from Nikki Catalysis, a hard carbon anode (which is more robust and has better/longer calendar life properties than the graphite anode in the Leaf’s battery cell) from Kureha, a Celgard PP dry/SRS separator, and a PC type LiPF6 electrolyte produced in-house by LG Chem.
There are two sources of battery capacity loss, calendar losses and cycling losses. Calendar capacity loss is the loss from the passage of time while the battery is left at a set SOC, typically 60% in lab testing. Cycling loss is due to charging and discharging (cycling) the battery. It depends on both the maximum state of charge (SOC) and the depth of discharge (DOD), which is the percentage of the total capacity range that is used during a cycle.
Technically, lithium battery calendar life is a function of 4 variables:
- Mean temperature
- Standard deviation of temperature
- Mean state of charge (SOC)
- Standard deviation of SOC
fµ(T), σ(T), µ(SOC), σ(ΔSOC) that varies negatively (inversely) with all 4 of those variables.
Here is a typical battery calendar capacity loss curve for Lithium Manganese batteries plotting Years to End of Life (typically 70% remaining capacity) vs. temperature:

The results given in the calendar life graph are for a steady-state, constant temperature T (thus where σ(T) = 0) and a steady-state, constant SOC equal to 60% SOC (thus where σ(ΔSOC) = 0). If the average SOC over time is greater than 60% SOC, calendar life will be less than that given in the graph. As the variability of both temperature σ(T) and the SOC cycling band σ(ΔSOC) increase, calendar life will decrease. At 60% SOC, lithium-manganese batteries have a little over 8 year life at 21C (70F) but only a 5 year life at 32C (90F). At higher states of charge, the heat sensitivity and degradation rate is even greater.
Charles Whalen goes on to say: “Temperature has a much greater effect on battery life than SOC. State of Charge (SOC) does have an effect, but in the opposite direction of what you might think. For lithium batteries — and *only* for lithium batteries (this does not apply to NiMH and lead-acid) — a lower average SOC (to a point, down to 30% SOC) over time will result in a longer battery life, and a higher average SOC over time will result in a shorter battery life. The LiMn2O4 chemistry that GM and Nissan are using in the first generation of the Volt and Leaf is very sensitive to heat and has a high rate of degradation once you get above 95 degrees F.”
In order to prolong battery life, GM uses just 65% of the Volts battery capacity, setting the limits at about 22% SOC on the low end and 87% SOC on the high end.
LiMn2O4 has two big problems at elevated temperatures: capacity fade over charge-discharge cycling, and dissolution of Mn into the electrolyte. Capacity retention is
almost constant below 50% SOC, but decreases with the SOC in the range of 50% to 80%. Batteries should be stored at the optimum storage state of charge which is between 30% and 40%. Another reference agrees with this range as optimal SOC for storage.
Surfingslovak reported on how depth of discharge (DOD) affects the rate of battery capacity loss: “The closest thing I found was a JPL report for the Mars Rover mission. They found the capacity fade from cycling to be about six times higher at 60% DOD when compared to 30% DOD. They used SAFT LiNiO2 cells with graphite anode and cylindrical stainless steel hardware. The cells were tested in 30% DOD regime (5000 cycles) with average energy fade rate at 4.0V at 0.000704% per cycle and 60% DOD regime (500 cycles) with average energy fade rate at 4.0V at 0.00430% per cycle.”
Another report, which does not specify the specific battery chemistry, shows a graph of remaining battery capacity vs number of cycles. The results (with cycles normalized to full cycle in parentheses):
- 100% to 0% – 1200 cycles (1200 cycles)
- 100% to 80% – 12000 cycles (2400 cycles)
- 80% to 0% – 5000 cycles (4000 cycles)
A DOD of 80% had made the battery last 3.3 times longer than a DOD of 100% (but remember that the Leaf limits battery use to some extent, allowing limits of SOC of 95% on the high end and 2% on low end).

tbleakne found a published paper that studied lithium-ion battery loss as a function of both temperature and SOC:
“Correlation of Arrhenius behaviors in power and capacity fades with cell impedance and heat generation in cylindrical lithium-ion cells” from Sandia National Laboratories.
This 2003 paper is obviously not talking about the LEAF’s particular Lithium chemistry (
LixNi0.8Co0.15Al0.05O2 cathode is used in the testing), but I believe the behaviors it describes are typical. Capacity fade is discussed on pg 7, Fig 5, which I display below:

The chart shows that capacity fade slows for all temperatures as the SOC is reduced from 100% to 80% to 60% SOC. At high state of charge the Li-ions are concentrated on the graphite electrode. My understanding is that the primary loss process takes place at this electrode, so it seems reasonable that this process would slow as the SOC lowers.
A question that is often asked is whether L2 charging (240 volts, 16 amps generally) is harmful to the battery. To put the question in perspective, you need to know that charging speed is measured by the C-rate, where 1 C is the current necessary to charge the battery in one hour. Since the Leaf with 3.3 kw charging takes a full charge in about 7 hours, the charging rate is C/7 (1/7 C). There is one study which measured the amount of capacity loss as a function of charging rate. It turned out that C/2 (about 12 kw for the Leaf) was the sweet spot and that slower or faster charging speeds had higher rates of capacity loss  :
:

Conclusion: L2 charging at 3.3 kw (or 6.0 kw in some 2013 Leafs) is not expected to have a deleterious effect on the rate of battery capacity loss.
Battery Aging Model
Some owners suggest that the battery degradation is contingent on Arrhenius Law formula of double the battery capacity degradation per 10 degrees Celsius rise in temperature. Using data from graphs at Weatherspark, (extracted by Stoaty using pixel counting in Photoshop), Surfingslovak estimated the relative rate of capacity loss for different cities in the United States based on Arrhenius Law and ambient temperature. The temperature was assumed to be the mid-point of each of the eight temperature bands. Rates of degradation were estimated relative to the Los Angeles Civic Center, chosen because Nissan based their testing on 12500 miles per year in that city. Based on this calculation, Leafs in Phoenix would be expected to lose battery capacity 2.64 times as fast as Leafs in Seattle all other factors being equal. Weatherman confirmed the calculations for some of the cities using hourly data (second column of table below). While the aging factors give a good idea of the order of the cities, the true values may have the scale expanded or contracted depending on the value of the activation energy (see tbleakne description below), so that the values are closer together or farther apart.
Note: NEC (Nissan’s partner in the AESC joint venture, which manufactures the battery packs for the LEAF) used Arrhenius Law in testing a new electrolyte additive that doubled the life of the battery. Interestingly, they found a factor of 3.2 in battery life between the hottest and coldest cities used in their simulation, close to the 2.64 factor estimated between Phoenix and Seattle. Using a model of 66% cycle time and 33% storage time they calculated a doubling of capacity loss with every 6.85 degrees C. increase in temperature for the newly developed battery.
Surfingslovak also developed a rough model to estimate how much capacity loss you may expect to see for your particular geographic location and planned annual mileage. Stoaty refined the spreadsheet model to match Nissan’s data obtained by TickTock in his discussion of Casa Grande testing with a Nissan engineer.
Battery Aging Model assumptions:
- Both calendar capacity loss and cycling capacity loss are temperature dependent
- Calendar capacity loss is proportional to the square root of time (e.g., 2 years would give 1.41 times the degradation seen at one year, meaning the second year would have 41% of the calendar loss of the first year)
- Solar loading loss (i.e., parking the car in the sun) was estimated based on a study of the Prius battery (
 ) and scaled using average annual solar radiation from the NREL:

The original version of the battery aging model was tuned empirically to reproduce as closely as possible TickTock’s graph of Nissan data. In order to fit the graph, it was discovered that the following additional assumptions were necessary:
- Calendar loss for the first year was 6.5% for the city with “normal” temperature
- Cycling loss for the “normal” city was 1.5% for every 10,000 miles driven at 4 miles per kwh
- Driving more efficiently than 4 miles per kwh would cause less cycling of the battery pack and reduce cycling loss proportional to the increase in efficiency. Conversely, less efficient driving would increase cycling loss
- The Phoenix Arrhenius aging factor slightly overestimates the hot climate aging; it was necessary to scale the aging factors to fit Nissan’s data. Note: The adjustment required the high aging factors like Phoenix to be scaled back (roughly 1.8 -> 1.5 for Phoenix on the scale we were using), although the model has the values adjusted to a slightly different baseline of 0.9 for “normal”, so the actual scaled value for Phoenix is 1.35
The graph and predictions of the Battery Aging Model are shown below:

The model was recently (October, 2013) updated and calibrated using Ah capacity measurements from Leaf Spy or the LeafDD. Using data reported from 22 Leafs (2011-2012 model years only, since the battery electrolyte was “tweaked” for 2013 Leafs), several changes were made to calibrate the model to fit the actual data:
- It was discovered that scaling the aging factors for cities with climates warmer than Los Angeles caused the prediction to underestimate the actual loss. Therefore, unscaled aging factors were used for these warmer climates
- Calendar loss was changed to 6.9% for the first year for the city with “normal” temperature (empirically derived to best fit the actual capacity loss data)
- Cycling loss for the “normal” city was changed to 2.0% for every 10,000 miles driven at 4 miles per kwh (empirically derived to best fit the actual capacity loss data)
- A correction factor was added to account for the fact that as the battery capacity diminished more full cycles would be necessary to drive a given distance (all other parameters being equal)
With these improvements to the model, actual loss as a percentage of predicted loss averages 100.04%, with a standard deviation of 10.13%. Note that the predicted rate of capacity loss is significantly increased with the revised model, in line with what has been observed. It is believed that this version is much more accurate, but of course it is still unknown whether the future predictions will track as closely as the calibrated current predictions.
The Battery Aging Model (version 1.00) is a spreadsheet which is available in:
- OpenDocument format (requires a free download of OpenOffice)
- Microsoft Excel earlier than 2007 (XLS file)
- Microsoft Excel 2007 and later (XLSX file) The XLSX version is now compatible with Google Drive. You can download it and put it on your own Google Drive.
- public version on Google Drive for those who don’t have OpenOffice or Microsoft Excel. This version has been modified by RegGuheert to put the input on a separate tab and protect the rest of the spreadsheet.
The Battery Aging Model is further discussed on the forum.
Predictions from the Battery Aging Model for different cities are shown below. For individualized predictions, download the Battery Aging Model spreadsheet above.
Note: These figures assume 12500 miles driven per year at 4.0 miles per hour efficiency, and do not include solar loading losses. The model also does not account for leaving the Leaf at 100% charge for significant periods of time (bad for the battery), frequent Quick Charging (bad for the battery), the average SOC the Leaf is kept at (lower is better, down to about 30%), the average depth of discharge (shallower is better), or the fact that the DOD will increase as the battery ages in order to cover the same distance on a charge.
Disclaimer: Take these predictions with a large grain of salt. They are simply our current best guess and hopefully provide more specific information than Nissan’s vague capacity statements. Predictions for SOC less than 70% or longer than 5 years are less likely to be meaningful. Your actual loss may be better or significantly worse than predicted.
| City | Aging Factor (unscaled) | Aging Factor Weatherman’s data | Solar Loading kwh/sq meter | Remaining Capacity 1 Year | Remaining Capacity 2 Years | Remaining Capacity 3 Years | Remaining Capacity 5 Years | Remaining Capacity 10 Years | End of Life (70% Remaining) |
|---|---|---|---|---|---|---|---|---|---|
| Dubai, UAE | 2.17 | 79.9% | 69.3% | 58.9% | 35.6% | < 5.0% | 1.9 years | ||
| San Juan, Puerto Rico | 1.87 | 7.1 | 82.6% | 73.6% | 65.0% | 46.9% | < 5.0% | 2.4 years | |
| Phoenix, AZ | 1.81 | 1.81 | 9 | 83.1% | 74.5% | 66.2% | 49.0% | < 5.0% | 2.5 years |
| Mesa, AZ | 1.78 | 9 | 83.4% | 74.9% | 66.8% | 50.1% | < 5.0% | 2.5 years | |
| Palm Springs, CA | 1.77 | 9 | 83.4% | 75.0% | 67.0% | 50.3% | < 5.0% | 2.6 years | |
| Fort Lauderdale, FL | 1.68 | 1.59 | 6.5 | 84.3% | 76.3% | 68.8% | 53.4% | < 5.0% | 2.8 years |
| Hong Kong Intl Airport | 1.67 | 1.59 | 84.3% | 76.4% | 69.0% | 53.7% | < 5.0% | 2.8 years | |
| Honolulu, HI | 1.67 | 1.59 | 7.7 | 84.3% | 76.4% | 69.0% | 53.7% | < 5.0% | 2.8 years |
| Las Vegas, NV | 1.50 | 9 | 85.8% | 78.8% | 72.3% | 59.2% | 13.0% | 3.3 years | |
| Orlando, FL | 1.47 | 1.39 | 6.5 | 86.1% | 79.2% | 72.8% | 60.0% | 16.4% | 3.4 years |
| Houston, TX | 1.47 | 1.35 | 6.5 | 86.2% | 79.3% | 73.0% | 60.2% | 17.3% | 3.4 years |
| Tucson, AZ | 1.45 | 9 | 86.3% | 79.6% | 73.3% | 60.8% | 19.2% | 3.5 years | |
| New Orleans, LA | 1.42 | 6.5 | 86.6% | 80.0% | 73.9% | 61.7% | 22.5% | 3.6 years | |
| Hilo, HI | 1.42 | 1.34 | 6 | 86.6% | 80.0% | 73.9% | 61.7% | 22.5% | 3.6 years |
| Ridgecrest, CA | 1.37 | 9 | 87.0% | 80.7% | 74.8% | 63.3% | 27.4% | 3.8 years | |
| San Antonio, TX | 1.37 | 6.5 | 87.0% | 80.7% | 74.8% | 63.3% | 27.4% | 3.8 years | |
| Jacksonville, FL | 1.36 | 6.5 | 87.1% | 80.8% | 75.0% | 63.5% | 28.1% | 3.8 years | |
| Austin, TX | 1.35 | 6.5 | 87.2% | 81.0% | 75.3% | 63.9% | 29.4% | 3.9 years | |
| Dallas, TX | 1.32 | 1.32 | 7 | 87.4% | 81.4% | 75.8% | 64.8% | 31.7% | 4.0 years |
| Witchita Falls TX | 1.32 | 1.32 | 7.5 | 87.4% | 81.4% | 75.8% | 64.8% | 31.7% | 4.0 years |
| Waxahachie, TX | 1.25 | 7 | 88.1% | 82.4% | 77.1% | 66.9% | 37.3% | 4.3 years | |
| Tyler, TX | 1.25 | 6.5 | 88.1% | 82.4% | 77.1% | 66.9% | 37.3% | 4.3 years | |
| Bakersfield, CA | 1.23 | 7.5 | 88.3% | 82.7% | 77.5% | 67.5% | 39.0% | 4.4 years | |
| Sevilla, Spain | 1.18 | 88.6% | 83.3% | 78.4% | 68.8% | 42.2% | 4.7 years | ||
| Jackson, MS | 1.18 | 6.5 | 88.6% | 83.3% | 78.4% | 68.8% | 42.2% | 4.7 years | |
| Fresno, CA | 1.17 | 7.5 | 88.8% | 83.5% | 78.6% | 69.2% | 43.0% | 4.8 years | |
| Memphis, TN | 1.16 | 6.5 | 88.9% | 83.7% | 78.9% | 69.6% | 44.1% | 4.9 years | |
| Palmdale, CA | 1.12 | 7.5 | 89.2% | 84.2% | 79.5% | 70.6% | 46.5% | 5.1 years | |
| Little Rock, AR | 1.12 | 6.5 | 89.2% | 84.2% | 79.5% | 70.6% | 46.5% | 5.1 years | |
| Ontario Intl Airport | 1.10 | 7.5 | 89.4% | 84.4% | 79.9% | 71.2% | 47.7% | 5.2 years | |
| Van Nuys, CA | 1.10 | 1.08 | 7.5 | 89.4% | 84.4% | 79.9% | 71.2% | 47.7% | 5.2 years |
| Riverside, CA | 1.09 | 9 | 89.5% | 84.6% | 80.1% | 71.5% | 48.3% | 5.3 years | |
| Visalia, CA | 1.09 | 7.5 | 89.5% | 84.6% | 80.1% | 71.5% | 48.3% | 5.3 years | |
| Modesto, CA | 1.08 | 7.5 | 89.6% | 84.8% | 80.4% | 71.9% | 49.3% | 5.4 years | |
| Tulsa, OK | 1.08 | 6.5 | 89.6% | 84.8% | 80.4% | 71.9% | 49.3% | 5.4 years | |
| Burbank, CA | 1.07 | 7.5 | 89.7% | 84.9% | 80.5% | 72.2% | 49.9% | 5.4 years | |
| Atlanta, GA | 1.07 | 6.5 | 89.7% | 84.9% | 80.5% | 72.2% | 49.9% | 5.4 years | |
| Oklahoma City, OK | 1.07 | 7.5 | 89.7% | 84.9% | 80.5% | 72.2% | 49.9% | 5.4 years | |
| Anaheim, CA | 1.06 | 7.5 | 89.7% | 85.0% | 80.7% | 72.4% | 50.3% | 5.5 years | |
| Sydney, Australia | 1.03 | 90.0% | 85.4% | 81.2% | 73.2% | 52.1% | 5.7 years | ||
| Charlotte, NC | 1.02 | 6.5 | 90.1% | 85.6% | 81.4% | 73.5% | 52.6% | 5.8 years | |
| Nashville, TN | 1.02 | 1.02 | 6.5 | 90.1% | 85.6% | 81.4% | 73.5% | 52.6% | 5.8 years |
| Norfolk, VA | 1.01 | 6.5 | 90.2% | 85.7% | 81.6% | 73.9% | 53.5% | 5.9 years | |
| Raleigh, NC | 1.00 | 1.04 | 6.5 | 90.3% | 85.8% | 81.8% | 74.1% | 54.1% | 6.0 years |
| Los Angeles Civic Center | 1.00 | 1.00 | 7.5 | 90.3% | 85.8% | 81.8% | 74.1% | 54.1% | 6.0 years |
| Ota, Japan | 0.98 | 90.4% | 86.0% | 82.0% | 74.4% | 54.7% | 6.1 years | ||
| Santa Ana, CA | 0.97 | 7.5 | 90.4% | 86.1% | 82.1% | 74.6% | 55.1% | 6.2 years | |
| San Diego, CA | 0.97 | 7.5 | 90.4% | 86.1% | 82.1% | 74.6% | 55.1% | 6.2 years | |
| Kansas City, MO | 0.97 | 6.5 | 90.4% | 86.1% | 82.1% | 74.6% | 55.1% | 6.2 years | |
| Knoxville, TN | 0.97 | 6.5 | 90.4% | 86.1% | 82.1% | 74.6% | 55.1% | 6.2 years | |
| Sacramento, CA | 0.96 | 7.5 | 90.5% | 86.2% | 82.2% | 74.8% | 55.5% | 6.2 years | |
| Lisbon, Portugal | 0.95 | 90.6% | 86.3% | 82.4% | 75.0% | 56.0% | 6.3 years | ||
| Albuquerque, NM | 0.94 | 9 | 90.6% | 86.4% | 82.6% | 85.3% | 56.6% | 6.4 years | |
| Santa Monica, CA | 0.93 | 7.5 | 90.7% | 86.4% | 82.6% | 75.3% | 56.6% | 6.4 years | |
| Los Angeles Intl Airport | 0.92 | 0.89 | 7.5 | 90.7% | 86.5% | 82.7% | 75.5% | 57.1% | 6.5 years |
| Madrid, Spain | 0.92 | 90.7% | 86.5% | 82.7% | 75.5% | 57.1% | 6.5 years | ||
| Santa Clara, CA | 0.90 | 7.5 | 90.8% | 86.7% | 83.0% | 75.9% | 57.9% | 6.6 years | |
| San Jose, CA | 0.90 | 7.5 | 90.8% | 86.7% | 83.0% | 75.9% | 57.9% | 6.6 years | |
| Prescott, AZ | 0.88 | 9 | 90.9% | 86.9% | 83.2% | 76.2% | 58.5% | 6.7 years | |
| Winchester, VA | 0.88 | 6.5 | 90.9% | 86.9% | 83.2% | 76.2% | 58.5% | 6.7 years | |
| Philadelphia, PA | 0.88 | 5.5 | 90.9% | 86.9% | 83.2% | 76.2% | 58.5% | 6.7 years | |
| Oceanside, CA | 0.85 | 7.5 | 91.1% | 87.1% | 83.5% | 76.7% | 59.5% | 6.9 years | |
| Salt Lake City, UT | 0.85 | 7.5 | 91.1% | 87.1% | 83.5% | 76.7% | 59.5% | 6.9 years | |
| Indianapolis, IN | 0.83 | 5.5 | 91.2% | 87.4% | 83.8% | 77.2% | 60.5% | 7.1 years | |
| Omaha, NE | 0.81 | 6.5 | 91.3% | 87.5% | 84.0% | 77.5% | 61.0% | 7.2 years | |
| Columbus, OH | 0.81 | 5.5 | 91.3% | 87.5% | 84.0% | 77.5% | 61.0% | 7.2 years | |
| Porto, Portugal | 0.81 | 0.81 | 91.3% | 87.5% | 84.0% | 77.5% | 61.0% | 7.2 years | |
| Melbourne, Australia | 0.80 | 91.4% | 87.6% | 84.1% | 77.6% | 61.3% | 7.3 years | ||
| Montclair, NJ | 0.80 | 5.5 | 91.4% | 87.6% | 84.1% | 77.6% | 61.3% | 7.3 years | |
| Reno, NV | 0.80 | 9 | 91.4% | 87.6% | 84.1% | 77.6% | 61.3% | 7.3 years | |
| Chicago, IL | 0.78 | 0.75 | 5.5 | 91.5% | 87.7% | 84.4% | 78.0% | 62.0% | 7.5 years |
| Pittsburgh, PA | 0.77 | 5.5 | 91.6% | 87.8% | 84.5% | 78.2% | 62.4% | 7.6 years | |
| Detroit, MI | 0.76 | 5.5 | 91.6% | 87.9% | 84.6% | 78.3% | 62.7% | 7.6 years | |
| San Francisco, CA | 0.76 | 7.5 | 91.6% | 87.9% | 84.6% | 78.3% | 62.7% | 7.6 years | |
| Boston, MA | 0.74 | 5.5 | 91.7% | 88.1% | 84.9% | 78.8% | 63.6% | 7.8 years | |
| Denver, CO | 0.73 | 0.70 | 7.5 | 91.8% | 88.2% | 85.0% | 78.9% | 63.9% | 7.9 years |
| Portland, OR | 0.72 | 5.5 | 91.9% | 88.3% | 85.1% | 79.1% | 64.3% | 8.0 years | |
| Minneapolis, MN | 0.70 | 5.5 | 92.0% | 88.5% | 85.4% | 79.5% | 65.1% | 8.2 years | |
| Paris, France | 0.69 | 92.0% | 88.6% | 85.4% | 79.6% | 65.3% | 8.3 years | ||
| Syracuse, NY | 0.69 | 5.5 | 92.0% | 88.6% | 85.4% | 79.6% | 65.3% | 8.3 years | |
| Seattle, WA | 0.69 | 4.5 | 92.0% | 88.6% | 85.4% | 79.6% | 65.3% | 8.3 years | |
| Madison, WI | 0.69 | 5.5 | 92.0% | 88.6% | 85.4% | 79.6% | 65.3% | 8.3 years | |
| London, England | 0.68 | 92.1% | 88.6% | 85.6% | 79.9% | 65.6% | 8.4 years | ||
| Vienna, Austria | 0.68 | 92.1% | 88.6% | 85.6% | 79.9% | 65.6% | 8.4 years | ||
| Toronto, Canada | 0.64 | 92.4% | 89.1% | 86.2% | 80.7% | 67.3% | 8.9 years | ||
| Montreal, Canada | 0.63 | 92.4% | 89.2% | 86.3% | 80.9% | 67.7% | 9.0 years | ||
| Olympia, WA | 0.63 | 0.58 | 4.5 | 92.4% | 89.2% | 86.3% | 80.9% | 67.7% | 9.0 years |
| Flagstaff, AZ | 0.62 | 9 | 92.5% | 89.2% | 86.4% | 81.0% | 67.9% | 9.1 years | |
| Vancouver, BC | 0.62 | 92.5% | 89.2% | 86.4% | 81.0% | 67.9% | 9.1 years | ||
| Shannon, Ireland | 0.61 | 0.58 | 92.5% | 89.3% | 86.5% | 81.2% | 68.3% | 9.3 years | |
| Bellingham, WA | 0.61 | 4.5 | 92.5% | 89.3% | 86.5% | 81.2% | 68.3% | 9.3 years | |
| Warsaw, Poland | 0.60 | 92.6% | 89.4% | 86.6% | 81.4% | 68.6% | 9.4 years | ||
| Big Bear City, CA | 0.59 | 0.54 | 9 | 92.7% | 89.6% | 86.8% | 81.6% | 69.1% | 9.6 years |
| Dublin, Ireland | 0.58 | 0.54 | 92.7% | 89.6% | 86.9% | 81.8% | 69.4% | 9.7 years | |
| Rygge, Norway | 0.52 | 93.1% | 90.2% | 87.7% | 83.0% | 71.6% | 10.6 years | ||
| Juneau, AK | 0.47 | 0.41 | 4.5 | 93.4% | 90.7% | 88.3% | 83.8% | 73.2% | 11.4 years |
Note: tbleakne suggests that the differences in temperature may have an even greater effect:
Arrhenius Factor: Exp(-(DeltaE)/kT) where:
- T is absolute temperature
- DeltaE is activation energy.
I agree the Arrhenius factor is very relevant, but how fast it varies with temperature depends upon the activation energy of the chemical process that is causing our degradation. A higher activation energy reduces the absolute magnitude of the factor, but it increases the relative change in the factor for a given change in temperature. This makes sense, since we are dealing with a very slow chemical process.
60 F is 540 Rankin (absolute). A 40 F change in temperature (60 vs 100 F) represents only a 40/540 = 7% change in absolute temperature, yet we are seeing perhaps a 5 to 1 change in relative degradation rates for folks in different climates.
Your rule that “10 degree Celsius increase in temperature doubles rate of battery capacity loss” implies a certain activation energy. The wide disparity between degradation for folks on this forum suggests a higher activation energy might be closer.
Real World Battery Capacity Losses
Even though there have been 112 documented cases of battery capacity loss of one or more bars (as of 10/13/2012), only 58 capacity loss cases have been reported to Nissan to our knowledge. The geographic breakdown of these cases is: Arizona – 53, Texas – 23, California – 31, Oklahoma – 1, Hong Kong – 1, Spain – 1, Unknown – 2. The breakdown by number of capacity bars lost is: one bar – 72, two bars – 29, three bars – 9, four bars – 2. Of the 40 Leafs that have lost 2 capacity bars, 33 are in Arizona, 4 in Texas and 3 in California. Most of the Leafs that have lost 3 or 4 or 5 capacity bars are in Arizona. Based on the approximately 450 Leafs sold in Arizona as of September 22, 2012, at least 11.8% of Arizona Leafs have lost a capacity bar. Since only cases reported on the forum are included in this calculation, the real number is likely to be much higher.
- Loss of seven battery capacity bars (52.5%).
- Loss of six battery capacity bars (46.25%).
- Loss of five battery capacity bars (40%).
- Loss of four battery capacity bars (33.75%).
- Loss of three battery capacity bars (27.5%).
- Loss of two battery capacity bars (21.25%).
- Loss of one battery capacity bar (15%).
Joeviocoe has produced a very nice dynamic spreadsheet Geographical Analysis of Nissan Leafs with Battery Capacity Loss, which now has a more complete Google map which geolocates all reported Leafs with battery capacity loss, and displays detailed information about each report upon mouse hover.

Additionally, Devin generated this geospatial analysis of Plug In America’s LEAF Battery Survey showing solar loading data from NREL. Created in ArcGIS from data gathered on March 27, 2014.
Analysis of Reported Cases of Battery Capacity Loss
While exposure to high ambient temperatures over time is thought to be the predominant factor in capacity bar loss, an analysis by Stoaty of the 26 reported cases in the Phoenix metro area showed that there was a moderate correlation between miles driven per month and the rate of battery capacity loss. The correlation coefficient was 0.51 and linear regression suggested that those who drove 1800 miles per month had a 2% per month capacity loss compared to 1% per month for those who drove 900 miles per month. The mean time to lose one capacity bar was 11.9 months, with a range of 7-16 months. Remember that this only applies to Phoenix owners who have lost a capacity bar, not the general population of Leafs. The analysis suggests that something related to charging and discharging the battery (leaving Leaf at high state of charge, high depth of discharge, number of battery charge cycles,etc.) is an additional factor affecting battery capacity loss. A similar analysis of Texas Leafs that had lost one capacity bar did not show any correlation between monthly mileage and rate of capacity loss, but the sample was much smaller (12 Leafs) and the climatic variation between different areas may have dominated. Phoenix Leafs that had lost a bar showed a mean rate of capacity loss of 1.3% per month; for Texas Leafs the value was 1.2% per month.
An analysis of the available data for all Leafs that had lost a second bar showed that the mean time between losing bars one and two was 52.7 days. The average rate of capacity loss between bars one and two was 3.7% per month (but note that most of these losses were during a hot summer, so do not extrapolate these loss rates to other areas of the country or other times of year). There was no correlation between mileage and rate of capacity loss between bars one and two.
Range Test on Cars with Battery Capacity Loss
In an effort to determine how much range was affected for those with lost battery capacity bars, a group of owners led by Tony Williams did a range test of 12 cars in Tempe, Arizona on September 15, 2012. A largely level course was driven at 100 km/h as measured by the LEAF’s onboard GPS (62 mph ground speed, 64 mph indicated speed as displayed on the LEAF’s speedometer) with the cruise control engaged. It was estimated that this speed would yield a target energy usage rate of 4 miles (6.437 km) per kWh without climate control. Based on Nissan’s published official range data below (from Nissan Technical Bulletin  ), it was determined that a new car would travel 84 miles (135 km) until “turtle” mode (a reduced power mode to safely get the vehicle off the road before the battery disengages power altogether). In addition to the extensive testing by Tony Williams that showed this to be the range of a new Leaf, there is another test that shows range of at least 84 miles. Further confirmation of the range of a new Leaf comes from a teardown of a Leaf by the NREL which revealed usable energy of a new Leaf at 21.381 kwh, which would result in a range of 85.5 miles at 4 miles/kwh:

Graph from NTB11-076a (only applies to a new Leaf) is shown below:

One deduction from this table is that Nissan expects a range of usable battery capacity of 19-21 kwh when the car is new. It would be surprising if manufacturing tolerances are that large, so it may be due to variations in the time between manufacture and when the buyer takes delivery, or more likely to give some leeway for some dealers who store unsold Leafs at 100% SOC in the hot sun. Another possibility is that up to 1 kwh may be due to pack imbalance. A fourth possible explanation for the range in the chart is variability in the economy meter due to instrumentation accuracies (i.e. Gids).
Results of the Tempe range test are shown below:
| Leaf | Capacity Bars | Stored Energy (Gids) | Miles (km) Driven | % New Car Capacity | Difference | Mileage (km) | M/kWh | Date Made | Volts | GOM | Comments |
|---|---|---|---|---|---|---|---|---|---|---|---|
| Blue494 | 8 | 61.9% | 59.3 (94.9) | 70.6% | 8.7% | 29000 (46500) | 3.7 | 4/2011 | 56 | ||
| White272 | 10 | 70.8% | 66.1 (105.8) | 78.7% | 7.9% | 17500 (28000) | 4.4 | 3/2011 | 68 | ||
| Blue744 | 9 | 67.0% | 72.3 (107.7) | 80.1% | 13.1% | 22400 (36000) | 4.4 | 4/2011 | 352.0 | 63 | No Turtle; 1 mile after VLB; added 5 miles |
| Red500 | 9 | 67.6% | 73.3 (110.9) | 82.5% | 14.9% | 22500 (37000) | 4.4 | 2/2011 | 342.5 | 66 | No turtle; 2 miles >VLB: Added 4 miles |
| White530 | 10 | 71.9% | 69.7 (111.5) | 83.0% | 11.1% | 12000 (20000) | 4.0 | 4/2011 | 73 | ||
| Red429 | 10 | 74.7% | 71.8 (114.9) | 84.5% | 9.8% | 11500 (18500) | 4.3 | 3/2011 | 74 | ||
| Silver679 | 10 | 75.8% | 71.8 (114.9) | 84.5% | 8.7% | 14750 (24000) | 4.2 | 5/2011 | 303.5 | 75 | 18.2 miles after LBW |
| Blue917 | 10 | 71.5% | 72.5 (116) | 86.3% | 14.8% | 13900 (22500) | 4.1 | 5/2011 | 310.5 | 67 | |
| White626 | 10 | 71.5% | 73.5 (117.6) | 87.5% | 16.0% | 17300 (28000) | 4.3 | 4/2011 | 317.5 | 73 | Capacity Bars were 10, reset to 12, now 11 |
| Blue534 | 10 | 75.0% | 75.7 (121.8) | 90.1% | 16.1% | 16000 (26000) | 4/2011 | 315.5 | 74 | ECO=84 | |
| Black782 (San Diego) | 12 | 88.6% | 76.6 (122.6) | 91.2% | 2.6% | 7,000 (11,000) | 3.9 | 4/2012 | 295 | 88 | ECO Out4.0/In3.8; LBW 6.9, VLB 6.5 |
| Blue842 | 12 | 85.0% | 79.6 (127.4) | 94.7% | 9.7% | 2,500 ((4,000)) | 4.1 | 4/2012 | 76 | ||
| RedXXX | 12 | 100.0% | 88.3 | 100.0% | 100 | 4.2 | 8/2012 | Control car run on different day |
More detailed results were released by Tony Williams showing that two of the cars did not reach turtle, but had slight adjustments made to compare them to the other cars.
Percent Capacity is based on the range of the vehicle divided by 84 miles for a new Leaf. The test results match very closely with the known capacity for two cars tested at Casa Grande. Red500 (Azdre/opossum) tested at 85% by Nissan, and was at 82.5% capacity during the range test. White 626 (Ticktock) tested at 87% by Nissan, and 87.5% during the range test.
Based on the work of Klapazius, the Apparent Capacity can be calculated from the range in miles divided by the miles per kwh that particular vehicle achieved. The Percent Apparent Capacity can be calculated by dividing the apparent capacity by 21 kwh, which is widely considered to be the usable capacity of a new Leaf. Columns in the table and graphs using Apparent Percent Capacity were originally included here, but were removed for two reasons: 1) the results were very similar to the graphs using Percent Capacity and 2) they relied on instrumentation which is likely faulty.
Here is a graph of Percent Capacity vs. Percent Gids (using corrected data above). Linear regression has correlation coefficient of 0.84. Note that 95% Gids predicts 100% capacity based on the linear regression line:

Here is a graph of Percent Capacity vs Total Miles Driven. Linear regression has a correlation coefficient of -0.85. Note that based on the linear regression line, for every 10,000 miles driven you would lose 7.5% of range capacity.

Stoaty noted that, “One thing is clear from Tony’s data: the percent Gids is lower than the percent of a “New Leaf Range” (84 miles) in every single case. It is reasonable to infer that a Leaf with 100% Gids would have at least 100% of the “New Leaf Range”. We see good evidence that there is a systematic bias in Gid percentage such that it under reports the available range.” Percent Range Capacity was on average 11% greater than predicted by the Gid Percent, with a standard deviation of 4%. In other words, on average adding 11 to the Gid Percent at a full charge will give you a close approximation of the actual range. However, for the two Leafs with Gid Percentage with at least 85% Gids remaining, the percentage to add to get estimated range capacity was much lower, averaging 6%. This suggests, but does not prove, that at lower Gid Percentages, the Gid meter becomes increasingly overly pessimistic in predicting actual range. The Gid Percentage does not accurately predict range. Calculations reveal that of the apparent capacity loss based on Gid Percentage, on average 42% was due to instrument error (range 22-64%) and the other 58% was due to actual battery capacity loss. Percent due to instrument error = difference/(100-Percent Gids).
Ingineer commented on the problems involved in accurately measuring SOC:
“The biggest problem with the Leaf’s Instrumentation/BMS (in my opinion) is the use of the Hall-effect current sensor. These are not very accurate for coulomb counting and subject to accuracy degrading effects, such as centerline drift, effects of the earths magnetic field, temperature, etc. The inaccuracy of this is why “some gids are more equal than others”. Nissan compensates for this inaccuracy by applying corrections to the SoC by sampling voltage and using it formulas that also take into account the temperature, internal resistance, aging, etc. This is why you can gain/lose SoC suddenly sometimes after power cycling. It will apply changes all at once if the car is power cycled, but if in use, it will apply a correction in the form of a drift which appears as faster/slower SoC counting than real energy out/in.”
drees comments on range loss:
“We all know that the average user doesn’t like to go below LBW – which means leaving 4 kWh (out of 22.5 kWh assuming 281GID and 1GID=80Wh) on the table. We’ll call 100% – LBW “usable”.
100% capacity = 22.5 kWh – 4 kWh = 18.5 kWh, 66 mi before LBW.
90% capacity = 20.3 kWh – 4 kWh = 16.3 kWh, 58 mi before LBW, 12% reduction in usable range.
85% capacity = 19.1 kWh – 4 kWh = 15.1 kWh, 54 mi before LBW, 19% reduction in usable range.
80% capacity = 18.0 kWh – 4 kWh = 14.0 kWh, 50 mi before LBW, 25% reduction in usable range.
70% capacity = 15.8 kWh – 4 kWh = 11.8 kWh, 42 mi before LBW, 36% reduction in usable range.
So for most people (who generally try to avoid LBW and below), the higher the capacity loss – the worse the reduction in range feels 20% worse because of the fixed LBW setting. This could be even worse since it appears that the BMS appears to bury even more of the battery below LBW once you’ve lost a bar or more…”
Nissan’s Responses and Actions
Here is Nissan’s official response so far, in the form of an open letter to Nissan LEAF owners. Tony Williams keeps an updated chronology of events related to battery capacity loss.
Summary of test data results reported on the forum (not from Nissan):
In late July, 2012, Nissan took 6 of the most severely affected Leafs with significant capacity loss to their Casa Grande testing facility in Arizona. One Leaf owner, Scott Yarosh, got his Leaf back with 3 capacity bars still missing (27.5% capacity loss), although Nissan removed the battery for bench testing and told him that he had only a 15% loss. Nissan later stated that the total number of cars test was seven. Another owner, Azdre/opossum were told that their Leaf has a 15% capacity loss, although the Leaf still showed 2 capacity bars missing (21.25% capacity loss). Their Leaf had the second best remaining capacity–the best was a 14% loss. A third owner, TickTock, got his car back with all 12 capacity bars restored. His testing suggested that he had not gained any capacity, but that a mis-calibrated sensor was reset and his Leaf now more accurately reports the actual capacity loss. He estimated that his real capacity loss was 15%, not 23%. Further testing showed that the value of a Gid (a unit of energy roughly equal to 80 watt-hours, named for Gary Giddings, who designed and built a meter to show battery state of charge) is apparently temperature dependent. Relying on the Gid-meter led to an inflated estimate of battery capacity loss. The entire thread can be read here.
As of September 8, 2012, the limited results available from Nissan’s testing suggest that part of the apparent capacity loss is due in some cases to the Leaf reporting a somewhat greater capacity loss than actually exists (6% greater in 2 cases, 12.5% greater in one case). However, all but one of the tested Leafs had at least a 15% loss of capacity, indicating that the problem is more than just incorrect reporting of the battery capacity.
On September 22, 2012 Nissan released another open letter about their findings from the testing at Casa Grande:
- The Nissan LEAFs inspected in Arizona are operating to specification and their battery capacity loss over time is consistent with their usage and operating environment. No battery defects were found.
- A small number of Nissan LEAF owners in Arizona are experiencing a greater than average battery capacity loss due to their unique usage cycle, which includes operating mileages that are higher than average in a high-temperature environment over a short period of time.
- Nissan asked Chelsea Sexton, a passionate advanced technology advocate, to convene an independent global advisory board (members picked by Chelsea)
In addition, Mark Perry of Nissan North America was quoted as saying the problem was related to high mileage of the affected Leafs, although several of the Leafs tested averaged close to Nissan’s 12,000 miles per year standard. The article was later updated with a quote from Nissan: “The average mileage for the cars investigated was 19,600 miles, and the average in-service time was 14.7 months,” wrote the company’s Katherine Zachary. “Average annual mileage those cars is about 16,000 per year, more than double the average Phoenix customer mileage of 7,500 miles per year.” Mark Perry also revealed for the first time that Nissan’s standard projections of 80% capacity retained at 5 years and 70% at 10 years are, “based on battery testing during development of the Leaf, assume the car covers 12,500 miles a year, in climates largely similar to those of Los Angeles (50 to 90 degrees F, with an average temperature of 68 or 70 degrees).” An article at insideevs reported Nissan projects 76% battery capacity retained for Arizona Leafs after 5 years. The article also states that there are 147 cases of loss of at least one capacity bar in the Southern United States, with 47 of those having less than 12,000 miles per year. No mention was made in the open letter or the comments by Mark Perry about the claim from Andy Palmer of Nissan that the problem is due to a faulty battery level display.
On September 26, 2012 it was reported that Nissan had agreed to buy back two Arizona Leafs with early capacity loss as a good will gesture under terms modeled after the Arizona Lemon Law. A Nissan engineer met with Ticktock, one of the Casa Grande 7, and answered questions about the test results. While he was not permitted to make copies of any graphs or other materials, Ticktock reconstructed a graph he was shown on expected battery capacity loss for Phoenix, Boston and the average for the U.S. The graph shows a steep decline in battery capacity during the first year, with an expected capacity loss of 11% in Phoenix and 7% in Boston. Most other areas of the country would fall somewhere in between, with the exception of Seattle, which probably has even lower capacity loss than Boston. The curves are based on annual mileage of only 7,500 miles for Phoenix, and a higher but unknown annual mileage for Boston:

On October 4, 2012 Nissan released a video of Chelsea Sexton interviewing Andy Palmer, Nissan executive vice president of product planning. The following points were made:
- To establish degradation expectations, Nissan used as a norm the LA4 driving cycle and 12,500 miles per year
- For that norm, expected degradation is 80% at 5 years and 70% at 10 years
- There are 4 variables that affect whether that mean will be achieved:
- The speed and gradient on which you drive–highway speed will have a greater degradation
- Frequent fast charging (recommend no more than one QC per day)
- Miles driven per year
- Temperature
- Arizona Leafs are averaging 7,500 miles per year (but this was not known prior to sale of the Leaf in Arizona, it is post hoc information)
- Based on 7,500 miles per year, the Arizona Leafs are projected to retain 76% of capacity after 5 years (translation: in order to have “only” 24% capacity loss at 5 years, Arizona Leafs are limited to driving 37,500 miles, and only driving the less demanding LA04 cycle)
- Capacity bar meter reads “pessimistically”
- Leaf has 95% satisfaction rate, the highest of any car Nissan sells
- 2013 model year will have evolutionary, not revolutionary changes; the gauge accuracy is addressed
- Nissan is looking at options to address the complaints about pressing “OK” on the Navigation screen each time Leaf is turned on
Note: the LA4 driving cycle, also known as the EPA Urban Dynamometer Driving Schedule, represents city driving conditions. It is shown below:

On Jun 7, 2013 Nissan announced that the battery warranty will apply to 2011-2012 Leafs, and that a software update will improve the accuracy of the battery capacity gauge to the same level as the 2013 Leafs.
While Nissan has not disclosed the price of a replacement battery pack, reliable sources (Ingineer and EVdriver) on mynissanleaf have stated that a replacement pack has an MSRP of $5,000 and that the price should be even lower once the Smyrna, Tennessee plant comes on line in early 2013. If confirmed, this would make a replacement pack a viable option for some if a Leaf battery pack fails sooner than expected. However, Chelsea Sexton was told by Andy Palmer of Nissan that this price was too low.
Actual Battery Remedial Actions
- Jan 23, 2014: one LEAF owner who lost 4 bars before 60 months/60,000 miles reported that a Nissan dealer’s service department has done the work to restore his LEAF back to 12 capacity bar. User got 84 miles out of the “restored” battery.
Minimizing Battery Capacity Loss
Before purchasing or leasing a Leaf, check the Battery Aging Factor for your City/State in the Factors Affecting Battery Capacity Loss section. If your Aging Factor is above 1.1, you are likely to experience faster capacity loss. The higher the number, the more likely you are to encounter problems.
Another method of estimating the likelihood of your Leaf experiencing temperature related accelerated battery capacity loss is to follow guidelines suggested by Weatherman:
- If you almost always see five bars or less on the battery temperature gage, and it only gets up to six bars a handful of times each summer… Don’t worry about it.
- If you see five bars or less during the winter half of the year, and fairly often see six bars during the summer half… You probably are going to see the loss claimed by Nissan (20% loss at 5 years and 30% loss at 10 years).
- If seeing six bars is common for a large part of the year, and a seventh bar pops up occasionally during the summer months… Consider leasing instead of buying the Leaf
- If you spend a large part of the summer with seven temperature bars or more showing… It’s probably best to avoid the Leaf completely. Consider an EV with an active thermal management system or the Chevy Volt.
You can inquire on the forum how many battery temperature bars others who live in your area are typically seeing.
A third method is to check the rough model developed by Surfingslovak to help estimate how much capacity loss you may expect to see for your particular geographic location and planned annual mileage. You can also download a local copy via Files -> Download As -> Microsoft Excel. Note that the model is overly pessimistic in some cases and overly optimistic in others, so don’t rely on it literally. For example, it predicts a 33% loss of capacity for Phoenix owners driving 7500 miles per year, while Nissan states 24% loss from their data.
For those that already own a Leaf, there are a few things you can do to minimize battery capacity loss:
- Keep the state of charge in the 30-40% range (on the Gid meter) as much of the time as reasonably possible. This roughly corresponds to 3-4 fuel bars for a new Leaf. Charge to 80% or 100% right before you need to make a longer drive.
- Shallower cycling (DOD) of the battery pack when possible. For example, two cycles of 60% to 30% SOC rather than one cycle of 90% to 30% should be better for the battery pack.
- Avoid parking in the sun when possible. Solar loading may increase the yearly average battery temperature by 1.3-3.1 degrees Celsius for a vehicle always parked in the sun (based on studies of the Prius,
 )
) - Drive and accelerate more slowly and more efficiently. This will have two effects:
- Minimizing waste heat (estimated to be 1% at 10 KW power draw, 3% at 30 KW power draw)
- Reduced cycling of the battery for the same number of miles driven, which will reduce cycling losses
To monitor the temperature of your battery pack, you can use the Leaf Battery Application.
Here are some useful tips from Ingineer on MNL forum
What To Do For Capacity Bar Loss
Call and report battery capacity loss to Nissan: 877-NO-GAS-EV (1-877-664-2738). Currently, Nissan only records battery capacity loss reports and assign a “case number” to each report; there is no other official action.
For current owners affected by significant battery capacity loss, you can file a complaint under your states Lemon Law, if available. On September 24, 2012 a class action lawsuit, Humberto Daniel Klee, et al. v. Nissan North America, Inc., et al., Case No. 12-cv-08238, U.S. District Court, Central District of California, Western Division that was been filed on behalf of Arizona and California Leaf owners. The lawsuit alleges that Nissan “failed to disclose its own recommendations that owners avoid charging the battery beyond 80% in order to mitigate battery damage and failed to disclose that Nissan’s estimated 100 mile range was based on a full charge battery, which is contrary to Nissan’s own recommendation for battery charging.” It further alleges that Nissan “failed to disclose and/or intentionally omitted to reveal a design defect in the Leaf’s battery system that causes the Leaf to suffer “widespread, severe and premature loss of driving range, battery capacity and battery life.” You can also read the actual court filing here: 
Media Coverage
- Phoenix’s KPHO’s fourth follow-up story
- Phoenix’s ABC15 story.
- Phoenix’s KPNX’s story.
- Phoenix’s KPHO’s third follow-up discussing Nissan buying back two Leafs with lost capacity
- Phoenix’s KPHO’s second follow-up story
- Phoenix’s KPHO’s follow-up story.
- Phoenix’s KPHO’s story.
- Tucson’s KOLD/KMSB’s story.
The only way to measure battery degradation is to read into the bms
With leafspy app